


A Likert scale is a psychometric rating scale widely used in surveys and questionnaires to measure attitudes, opinions, perceptions, and behaviors. Unlike simple yes/no questions, Likert scales capture the intensity of respondents' feelings toward a given statement or question. This measurement tool provides a structured way to collect and quantify subjective data that would otherwise be difficult to measure.
At its core, a Likert scale consists of a statement or question followed by a series of response options that represent varying degrees of agreement, satisfaction, frequency, or other dimensions being measured. These response options are presented on a continuum, typically ranging from one extreme to another (e.g., from "Strongly Disagree" to "Strongly Agree").
The primary value of Likert scales lies in their ability to transform qualitative opinions into quantifiable data that can be analyzed statistically. This makes them an essential tool for researchers, businesses, and organizations seeking to understand the nuances of human attitudes and behaviors.
History and Origins
The Likert scale was developed in 1932 by American social psychologist Rensis Likert as part of his doctoral dissertation at Columbia University. Likert sought to improve upon existing methods of measuring attitudes, which were often limited to simple yes/no responses.
Likert's innovation was to develop a scale that could capture the intensity of feelings about a topic rather than just their direction (positive or negative). His original scale used five points of agreement: strongly approve, approve, undecided, disapprove, and strongly disapprove. This allowed for more nuanced measurements of attitudes and opinions.
While Likert originally pronounced his name "LICK-ert," the scale is commonly pronounced "LIKE-ert" today. Regardless of pronunciation, Likert's contribution revolutionized attitude measurement in psychology, sociology, market research, and other fields that rely on understanding human perceptions and behaviors.
Components of a Likert Scale
The Statement or Question
The foundation of any Likert scale item is the statement or question being evaluated. For accurate and meaningful results, this component should be:
- Clear and unambiguous: Easy for respondents to understand
- Focused on a single concept: Measuring only one attitude or opinion at a time
- Relevant to the respondent: Addressing topics the respondent has experience with
- Balanced: Avoiding leading or biased language
The Response Options
The response options form the scale itself. These typically include:
- Anchor points: The labels at each end of the scale (e.g., "Strongly Disagree" and "Strongly Agree")
- Intermediate points: Labels between the anchor points (e.g., "Disagree," "Neither Agree nor Disagree," "Agree")
- Scaling: The number assignment to each response for quantitative analysis (e.g., 1-5 or 1-7)
Visual Presentation
How the Likert scale is presented visually can impact response patterns. Key aspects include:
- Layout: Horizontal or vertical arrangement of response options
- Spacing: Equal spacing between options to avoid suggesting some are more important
- Visual aids: Optional use of images, colors, or symbols to enhance understanding
Types of Likert Scales
By Number of Points
5-Point Likert Scale The most common format, offering a balanced range of options:
- Strongly Disagree (1)
- Disagree (2)
- Neither Agree nor Disagree (3)
- Agree (4)
- Strongly Agree (5)
7-Point Likert Scale Provides more granularity for respondents to express their opinions:
- Strongly Disagree (1)
- Disagree (2)
- Somewhat Disagree (3)
- Neither Agree nor Disagree (4)
- Somewhat Agree (5)
- Agree (6)
- Strongly Agree (7)
4-Point or 6-Point Likert Scale (Forced Choice) Removes the neutral option, requiring respondents to lean toward agreement or disagreement:
- Strongly Disagree (1)
- Disagree (2)
- Agree (3)
- Strongly Agree (4)
By Measurement Dimension
Agreement Scales Measure level of agreement with a statement:
- "I enjoy shopping at this store."
- Strongly Disagree to Strongly Agree
Frequency Scales Measure how often something occurs:
- "How often do you purchase products online?"
- Never to Always
Satisfaction Scales Measure level of satisfaction with a product, service, or experience:
- "How satisfied are you with our customer service?"
- Very Dissatisfied to Very Satisfied
Quality Scales Measure perceived quality:
- "How would you rate the quality of our product?"
- Very Poor to Excellent
Importance Scales Measure how important something is:
- "How important is price when making purchasing decisions?"
- Not Important at All to Extremely Important
Likelihood Scales Measure probability of future actions:
- "How likely are you to recommend our service to others?"
- Extremely Unlikely to Extremely Likely
Unipolar vs. Bipolar Scales
Unipolar Scales Measure from zero to a maximum amount of a single attribute:
- "How helpful was our support team?"
- Not Helpful at All to Extremely Helpful
Bipolar Scales Measure between two opposite attributes:
- "How was your experience with our product?"
- Very Negative to Very Positive
When to Use Likert Scales
Likert scales are most effective when:
1. Measuring Attitudes, Opinions, and Perceptions
When you need to understand how people feel about something rather than just factual information, Likert scales excel at capturing subjective attitudes that would be limited by yes/no questions.
2. Quantifying Qualitative Concepts
When you need to translate subjective feelings into numerical data for analysis, Likert scales bridge the gap between qualitative and quantitative research.
3. Tracking Changes Over Time
When you want to monitor shifts in sentiment, satisfaction, or other attitudes, Likert scales provide a consistent measurement framework that allows for longitudinal comparison.
4. Comparing Groups
When you need to identify differences in attitudes or perceptions between demographic groups, departments, or other segments, Likert scales facilitate statistical comparisons.
5. Gathering Feedback on Multiple Dimensions
When you want to evaluate various aspects of a product, service, or experience, Likert scales can be applied consistently across different dimensions for holistic assessment.
Creating Effective Likert Scale Questions
Carefully crafted questions and response options are essential for collecting accurate and meaningful data from respondents.

Statement Formulation
Be Clear and Specific
- Avoid ambiguity and jargon
- Focus on one idea per statement
- Use language appropriate for your audience
Balance Positive and Negative Statements
- Include both positively and negatively worded items
- This helps identify respondents who aren't reading questions carefully
- Example pair:
- "I find the website easy to navigate" (positive)
- "I struggle to find what I need on the website" (negative)
Avoid Double-Barreled Questions
- Don't ask about two concepts in one statement
- Poor: "The product is affordable and high-quality"
- Better: Split into two separate statements
Use Clear Timeframes When Relevant
- Specify the period you're asking about
- Example: "In the past month, how often have you..."
Scale Design Considerations
Choosing the Number of Points
- More points: Greater precision but potentially more cognitive load
- Fewer points: Simpler for respondents but less granular data
- Consider your analysis needs and respondent characteristics
Including a Neutral Option
- Pros: Allows for genuine neutrality, reduces forced opinions
- Cons: May encourage non-committal responses
- Decision should align with research objectives
Labeling Points
- Fully labeled: Every point has a text label
- End-anchored: Only endpoints are labeled
- Fully labeled scales are generally easier for respondents
Visual Presentation
- Consistent spacing between options
- Clear visual distinction between items
- Consider mobile responsiveness for digital surveys
Read - 60+ Likert Scale Questions with Examples
Common Response Formats
These standardized formats help ensure consistency and clarity in survey responses.

Agreement Scales
Strongly Disagree | Disagree | Neither Agree nor Disagree | Agree | Strongly Agree
Frequency Scales
Never | Rarely | Sometimes | Often | Always
Satisfaction Scales
Very Dissatisfied | Dissatisfied | Neutral | Satisfied | Very Satisfied
Quality Scales
Very Poor | Poor | Fair | Good | Excellent
Importance Scales
Not at all Important | Slightly Important | Moderately Important | Very Important | Extremely Important
Likelihood Scales
Definitely Not | Probably Not | Possibly | Probably | Definitely
Numeric Scales
1 | 2 | 3 | 4 | 5 | 6 | 7 | 8 | 9 | 10
Analyzing Likert Scale Data
Proper analysis techniques are crucial for extracting meaningful insights from Likert scale responses while respecting their statistical properties.
Data Type Considerations
Ordinal vs. Interval Debate
- Likert data is technically ordinal (ranked but with unequal intervals)
- Some researchers treat it as interval data (equal distances between points)
- This is a longstanding methodological debate in research
Individual Items vs. Composite Scales
- Individual items: Analyzed as distinct questions
- Composite scales: Multiple related items combined into an overall score
Descriptive Statistics
Appropriate Central Tendency Measures
- Median: Most appropriate for ordinal data
- Mode: Shows most common response
- Mean: Controversial for individual items but commonly used for composite scales
Frequency Distributions
- Count and percentage of responses for each option
- Often visualized with bar charts or histograms
Visualization Methods
- Bar charts: Show distribution of responses
- Diverging stacked bar charts: Highlight positive vs. negative sentiment
- Radar/spider charts: Compare multiple dimensions
Inferential Statistics
Non-Parametric Tests (Conservative Approach)
- Mann-Whitney U test: Compare two independent groups
- Wilcoxon signed-rank test: Compare two related samples
- Kruskal-Wallis test: Compare three or more independent groups
- Spearman's rank correlation: Assess relationships between variables
Parametric Tests (Common but Debated)
- t-tests: Compare means between two groups
- ANOVA: Compare means across multiple groups
- Pearson correlation: Measure linear relationships
- Regression analysis: Predict outcomes based on Likert responses
Reliability and Validity
Cronbach's Alpha
- Measures internal consistency of multi-item scales
- Values above 0.7 generally indicate acceptable reliability
Factor Analysis
- Identifies underlying dimensions in multi-item scales
- Helps validate construct measurement
Benefits of Using Likert Scales
1. Quantification of Subjective Data
Likert scales transform subjective opinions and feelings into numerical data that can be analyzed statistically, bridging qualitative and quantitative research approaches.
2. Ease of Administration
The format is intuitive for most respondents, requiring minimal explanation and making it suitable for various survey methods including online, paper, and in-person.
3. Flexibility and Adaptability
Likert scales can be used to measure diverse concepts across different contexts, from customer satisfaction to employee engagement, brand perception, and more.
4. Nuanced Insights
Unlike binary questions, Likert scales capture the intensity of opinions, providing a more detailed understanding of respondent attitudes.
5. Standardization
The consistent format allows for comparisons across different questions, time periods, or demographic groups.
6. Established Validity
Decades of research have established Likert scales as valid measurement tools when properly designed and implemented.
Likert Scale Best Practices for Implementation
Following these guidelines will help you design more effective Likert scale surveys and improve the quality of your data.
Survey Design
- Limit the number of items - Keep surveys concise to prevent fatigue; focus on essential measurements
- Group similar items together - Organize by topic or dimension; maintain consistent response formats within sections
- Include instructions - Clearly explain how to use the scale; provide context for what is being measured
- Test before full deployment - Pilot test with a small group; check for clarity and effectiveness
Response Option Optimization
- Maintain consistency - Use the same scale throughout where possible; if multiple scales are needed, clearly distinguish them
- Balance the scale - Equal number of positive and negative options; clear neutral point when appropriate
- Label all points - Fully labeled scales reduce ambiguity; ensure labels are clearly understood
- Consider cultural context - Adapt scales for international use; be aware of cultural response tendencies
Data Collection
- Ensure anonymity when appropriate - Increases honesty, especially for sensitive topics; clearly communicate privacy protections
- Provide adequate time - Allow respondents sufficient time to consider responses; avoid rushing, which leads to less thoughtful answers
- Consider multiple channels - Offer paper, online, or mobile options as appropriate; ensure consistent presentation across channels
Analysis and Reporting
- Document scale properties - Report reliability measures for multi-item scales; explain how data was treated (ordinal vs. interval)
- Present visual summaries - Use appropriate visualizations for Likert data; include distribution information, not just averages
- Acknowledge limitations - Discuss potential biases in your findings; consider complementary qualitative insights
Common Use Cases
Likert scales are versatile tools used across multiple industries to measure attitudes, perceptions, and experiences.
Customer Experience spans multiple measurement tools including Customer Satisfaction Surveys ("How satisfied are you with your recent purchase?"), Net Promoter Score (NPS) measuring recommendation likelihood on a 0-10 scale, and Customer Effort Score (CES) evaluating interaction ease.
Employee Experience utilizes engagement surveys measuring workplace satisfaction ("I feel motivated to go beyond what is expected"), employee NPS ("How likely are you to recommend this company?"), and 360-degree feedback for structured peer evaluations.
Market Research applications include brand perception studies, product testing, and concept testing to evaluate potential offerings, while Education employs course evaluations and learning assessments.
In Healthcare, patient satisfaction surveys and self-reported health assessments ("How would you rate your current pain level?") provide critical insights for care improvement.
Revolutionizing Likert Scales with AI Technology
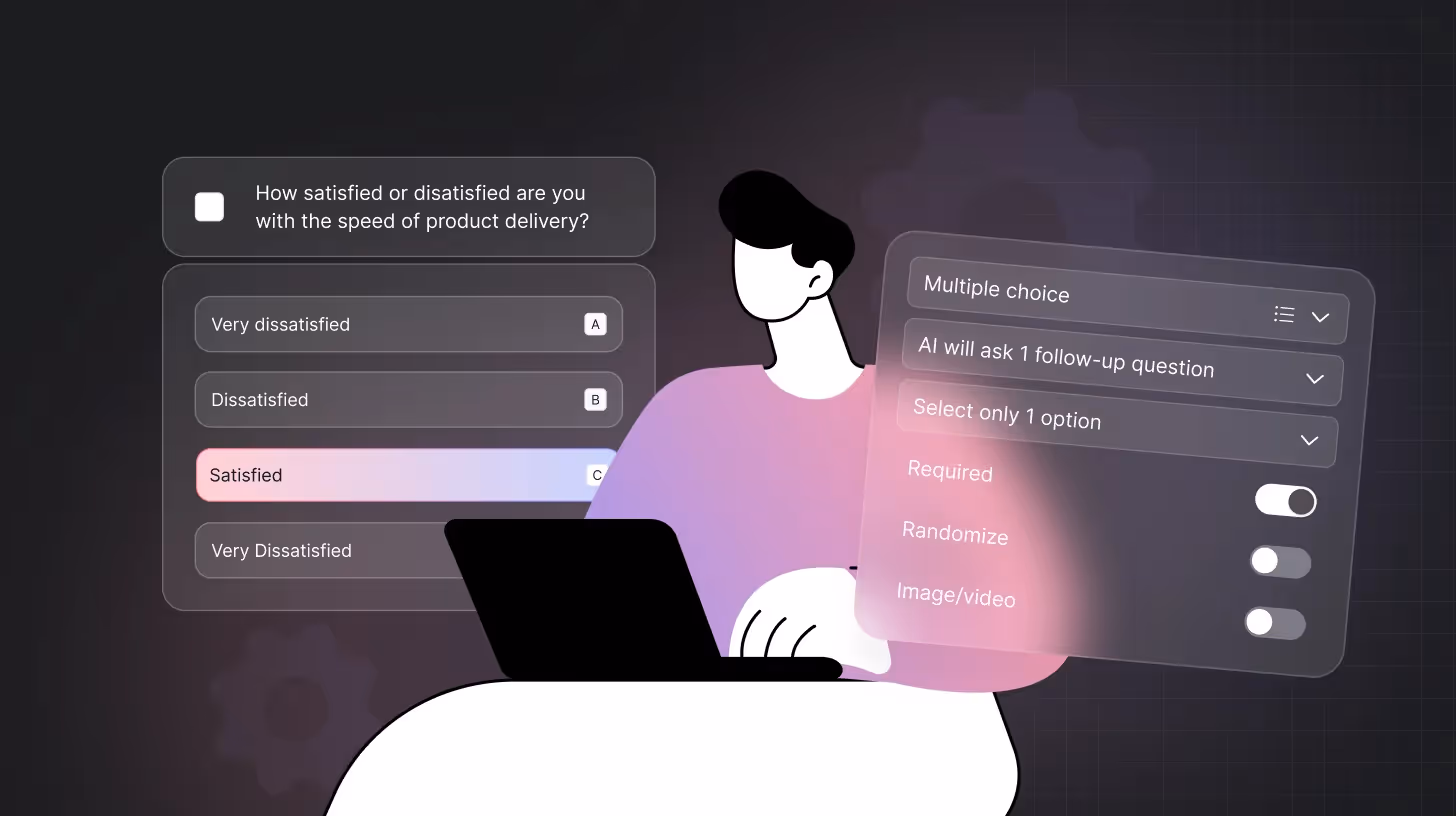
Traditional Likert scales, while effective, have limitations that modern AI-powered survey tools can overcome. TheySaid has transformed the standard Likert scale experience by addressing common challenges and enhancing the quality of insights gained.
Limitations of Traditional Likert Scales
Traditional Likert scale surveys face several challenges:
- Surface-level insights: Standard scales capture what people think but not why they think it
- Survey fatigue: Respondents get bored with repetitive rating questions
- Limited context: The "why" behind ratings remains unclear without additional questions
- Analysis challenges: Making sense of open-ended follow-up responses is time-consuming
- Low response rates: Traditional surveys often struggle with participation
How TheySaid Transforms Likert Scale Surveys
TheySaid enhances Likert scales through AI-powered conversational surveys with these key features:
AI-Enhanced Capabilities
- One-click survey creation with optimal question formulation
- Conversational follow-ups that probe for deeper insights
- Dynamic adaptation based on previous responses
- Automated theme identification and sentiment analysis
Business Benefits
- Higher completion rates through engaging experiences
- Richer contextual data beyond traditional ratings
- Time savings in survey design and analysis
- Multi-channel distribution options
Our tool transforms feedback collection from static measurement into dynamic insight generation, providing you a more complete understanding of attitudes and opinions.

.avif)


.svg)