


If surveys and your market research were detective stories, sampling error would be the sneaky culprit hiding in plain sight. You have cracked the case with solid data, but then bam,the sample doesn’t quite reflect reality, and your conclusions wobble.
Sampling error is an unavoidable discrepancy that occurs when you study a portion of a population instead of the whole thing. If left unchecked, it can distort insights, weaken decisions, and even derail entire projects.
This blog serves as your go-to guide for understanding sampling error, including its definition, various types, primary causes, calculation methods, and effective ways to minimize it. Whether you’re a student, researcher, or business professional, knowing how sampling error works can save you from making misleading conclusions based on shaky data.
So, grab your coffee and let’s dive in!
TL;DR
Sampling error is the natural difference between survey results from a sample and the true values of an entire population. It happens because samples can never perfectly represent everyone. Common types include random error, systematic error, undercoverage, nonresponse, and over/underrepresentation. You can reduce sampling error by increasing sample size, using random sampling methods, ensuring representativeness, and replicating studies.
Read: Everything You Need to Know About Survey Sampling in Research and Business
What is Sampling Error?
Before we discuss sampling errors, let’s first understand what sampling is. In research and surveys, it’s impossible and impractical to study an entire population. The practical solution is to take a part of the population that represents the whole. It’s like tasting a spoonful of soup from a pot to judge the flavor of the entire pot. If the sample size is too big, you are doing a lot of hard work without any meaningful insights. If the sample size is too small, your results may not accurately reflect the population, leaving you with unreliable conclusions.
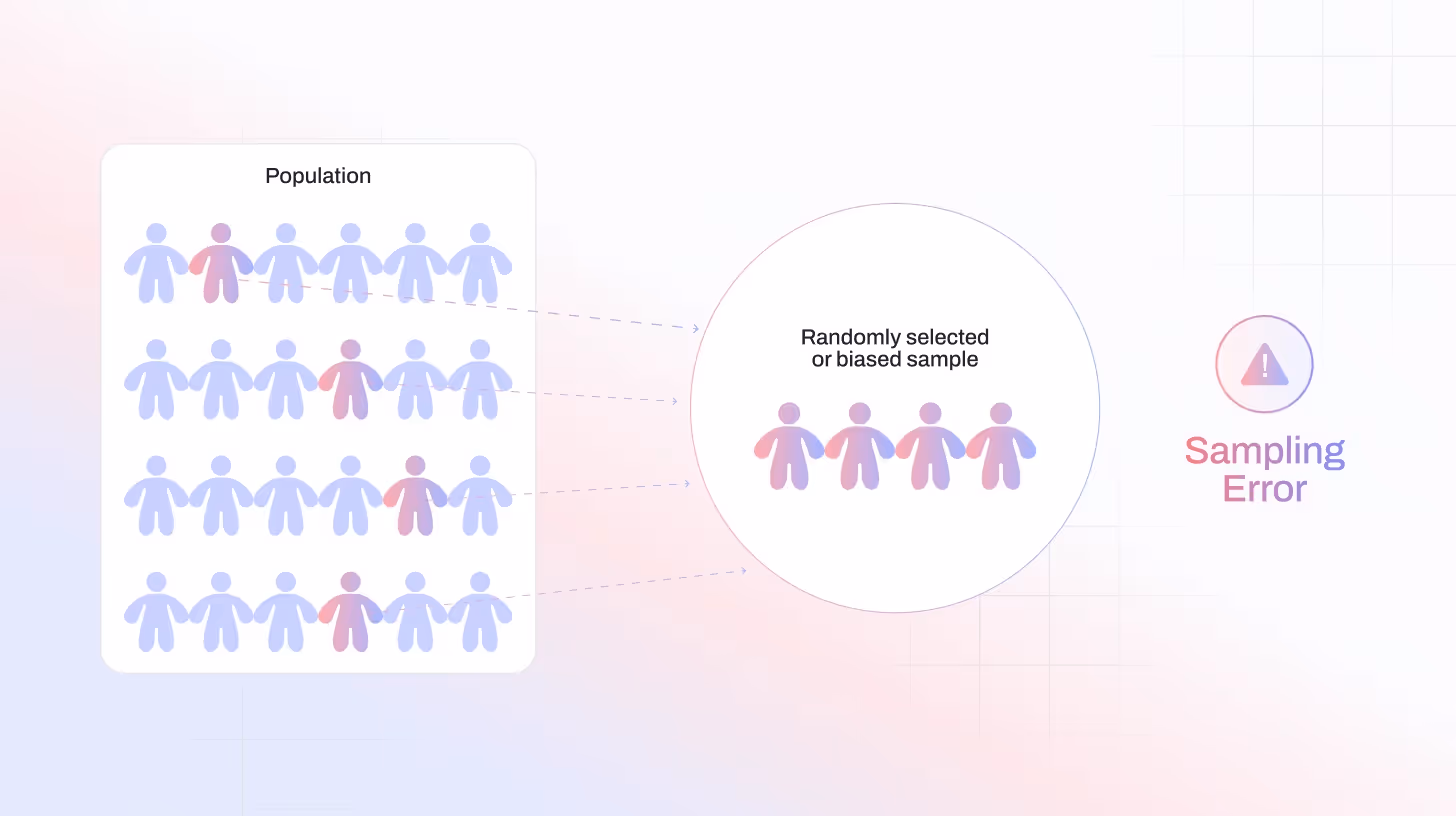
Now here’s where sampling errors come in. Simply put, a sampling error is the difference between the results from your sample and the true values of the population it’s meant to represent.
Let’s better understand it with an example. A company wants to measure customer satisfaction with its newly launched smartphone. Surveying every single customer would be impossible, so they select a sample of 1000 customers. If 70% of the sample says they are satisfied, but the actual satisfaction rate among all customers is 75%, the 5% difference is the sampling error.
Even with a carefully chosen sample, small gaps like these are natural, but understanding them helps businesses make better, data-driven decisions.
How to Recognize Sampling Errors?
Sampling error happens when your survey or study results don’t quite match the true picture of the entire population. In other words, your sample isn’t perfectly reflecting everyone you want to understand. Here are some signs and techniques to identify sampling errors in your survey results and research
It can sneak in when:
- Your sample is chosen randomly, but doesn’t fully represent the population.
- There’s some bias in how you collected the data.
- The population is very diverse, making it hard for a small group to capture all the differences.
You can often spot sampling error when:
- Your results look different from what you expected or from previous studies.
- Running the same survey with a different group gives slightly different answers.
- Small samples produce results that jump around more than larger ones.
A clothing brand surveys 150 customers about a new product line. The survey shows 65% of customers like it. Later, after a nationwide launch, only 58% of all customers actually liked it. That gap? That’s sampling error, the natural difference between a small sample and the entire population.
How to Calculate Sampling Error
Calculating sampling error might sound complicated, but it’s actually pretty straightforward once you know the basic formula.
Step 1: Know the formula
The most common way to calculate sampling error for a proportion is:

Where:
- Z = Z-score (depends on your confidence level; for 95% confidence, Z ≈ 1.96)
- p = proportion of the sample with the characteristic you’re measuring (e.g., 0.7 for 70%)
- n = sample size
Step 2: Plug in the numbers
Example: A company surveys 400 customers to see if they like a new product. 70% of respondents say yes.

So, the sampling error is about 4.5%.
This means the true proportion of all customers who like the product is likely between 65.5% and 74.5% (70% ± 4.5%) with 95% confidence.
Step 3: Interpret it
- A smaller SE means your sample is likely closer to the true population value.
- A larger SE indicates more uncertainty and potential variability.
Types of Sampling Error
Sampling errors don’t always look the same. They can show up in different ways depending on how the data is collected. Broadly, there are two main types you’ll come across: random sampling error and systematic sampling error. Understanding these helps you know whether the issue was just by chance or because of a flaw in the sampling process itself.
1. Random Sampling Error
This type of error happens simply because we’re working with a subset of people, not the entire population. No matter how carefully you design your study, there will always be some degree of random difference between your sample and the full group.
Imagine a retail brand wants to measure customer satisfaction across 10,000 shoppers. They surveyed 400 randomly selected customers. By chance, the sample ends up with more frequent buyers than casual shoppers. Since frequent buyers are usually happier, the results show a slightly higher satisfaction score than reality. That difference is a random sampling error.
How to reduce it: Increase your sample size. The bigger the sample, the closer it will reflect the true population.
Also read: A Complete Guide to Random Sampling Methods and Techniques
2. Systematic Sampling Error
Unlike random error, this one isn’t about chance; it’s about bias. Systematic sampling error happens when the way you collect your sample consistently skews the results in one direction. It often comes from flawed sampling methods or an incomplete sampling frame.
For example, A health researcher wants to study eating habits across a city. But instead of sampling from all neighborhoods, they only survey people at gyms. Since gym-goers are generally more health-conscious, the results underestimate junk food consumption in the city. That’s a systematic error.
How to reduce it: Double-check your sampling frame and make sure every group in your target population has a fair chance of being included.
Read - Sampling Design Explained: Steps, Challenges, and AI Solutions
3. Undercoverage Error
Undercoverage happens when some groups in your target population never even make it into your sample. The result? Your data only tells part of the story, and entire perspectives are missing.
For example, imagine an e-commerce company running a survey on online shopping but only targeting desktop users. Mobile app shoppers who may buy more often and in different ways get overlooked. The findings then fail to reflect how the majority of customers actually shop.
How to reduce it: To reduce undercoverage, make sure your survey reaches people across all relevant channels and platforms.
4. Nonresponse Error
Sometimes, the problem isn’t who you ask, it’s who actually responds. Nonresponse error happens when certain types of people are less likely to participate, leaving you with answers that don’t represent the full range of opinions.
For example, A bank emails a survey to 1,000 customers asking about service satisfaction. Only the happiest and angriest customers reply, while the majority stay silent. The results make it seem like opinions are extreme, but in reality, most customers are somewhere in the middle.
How to reduce it: Use reminders, multiple contact methods, and small incentives to encourage broader participation.
5. Overrepresentation / Underrepresentation Error
This occurs when certain groups show up in the sample more (or less) than they should compared to the actual population. The imbalance leads to results that don’t line up with reality.
For example, A fitness app asks users about workout habits but ends up with mostly gym enthusiasts filling out the survey. Casual users who only walk or do yoga aren’t represented enough, so the results exaggerate how often people really exercise.
How to reduce it: To reduce this error, carefully design your sampling strategy and consider weighting responses to reflect the true population proportions.
The takeaway? Sampling errors can show up in many shapes, from accidental randomness to built-in biases. Knowing which type you’re dealing with is the first step toward reducing its impact and getting closer to the truth.
Read: Probability vs Non-Probability Sampling: A Complete Guide for Researchers
How to Reduce Sampling Errors
Here’s the truth: you can never eliminate sampling error completely but you can shrink it down so your results are far more reliable. Think of it like tuning a guitar: you’ll never remove all background noise, but you can get the notes as close to perfect as possible. Here’s how:
1. Increase Your Sample Size
The easiest and most effective way to reduce sampling error is to simply ask more people. Larger samples are closer to the true population and leave less room for random swings.
For example, A survey of just 10 customers about their favorite pizza topping could give wildly different results compared to a survey of 1,000. The larger group smooths out those individual quirks and gives you a more accurate picture.
The U.S. Bureau of Labor Statistics surveys about 119,000 businesses and government agencies every month for its Employment Situation Report. Because the sample is so large, the margin of sampling error is extremely small.
Read - A Complete Guide to Stratified Random Sampling for Researchers
2. Use Random Sampling Methods
Randomness isn’t just fair, it’s powerful. By giving everyone in your population an equal chance of being selected, you reduce hidden biases.
For example, instead of casually picking people to interview, a researcher could survey every 10th person on a list. This avoids the subconscious habit of choosing people who “look approachable,” which could distort results.
3. Make Sure the Sample Represents the Whole Population
A sample isn’t useful if it leaves out key groups. Always check that your participants actually reflect the diversity of the population you’re studying.
For example, if a streaming service only surveys city users, they’ll miss rural viewers who may have different preferences (like downloading movies instead of streaming).
4. Replicate Your Study
One survey or study can be a fluke. Replicating your research by running the same survey multiple times or across different groups helps balance out errors and confirms your findings.
For example, A skincare brand might run the same product survey with 500 customers in one city and 500 in another. If results line up, they know the insights are solid.
Also Read: A Complete Guide to Stratified Random Sampling for Researchers
Sampling Error vs. Non-Sampling Error
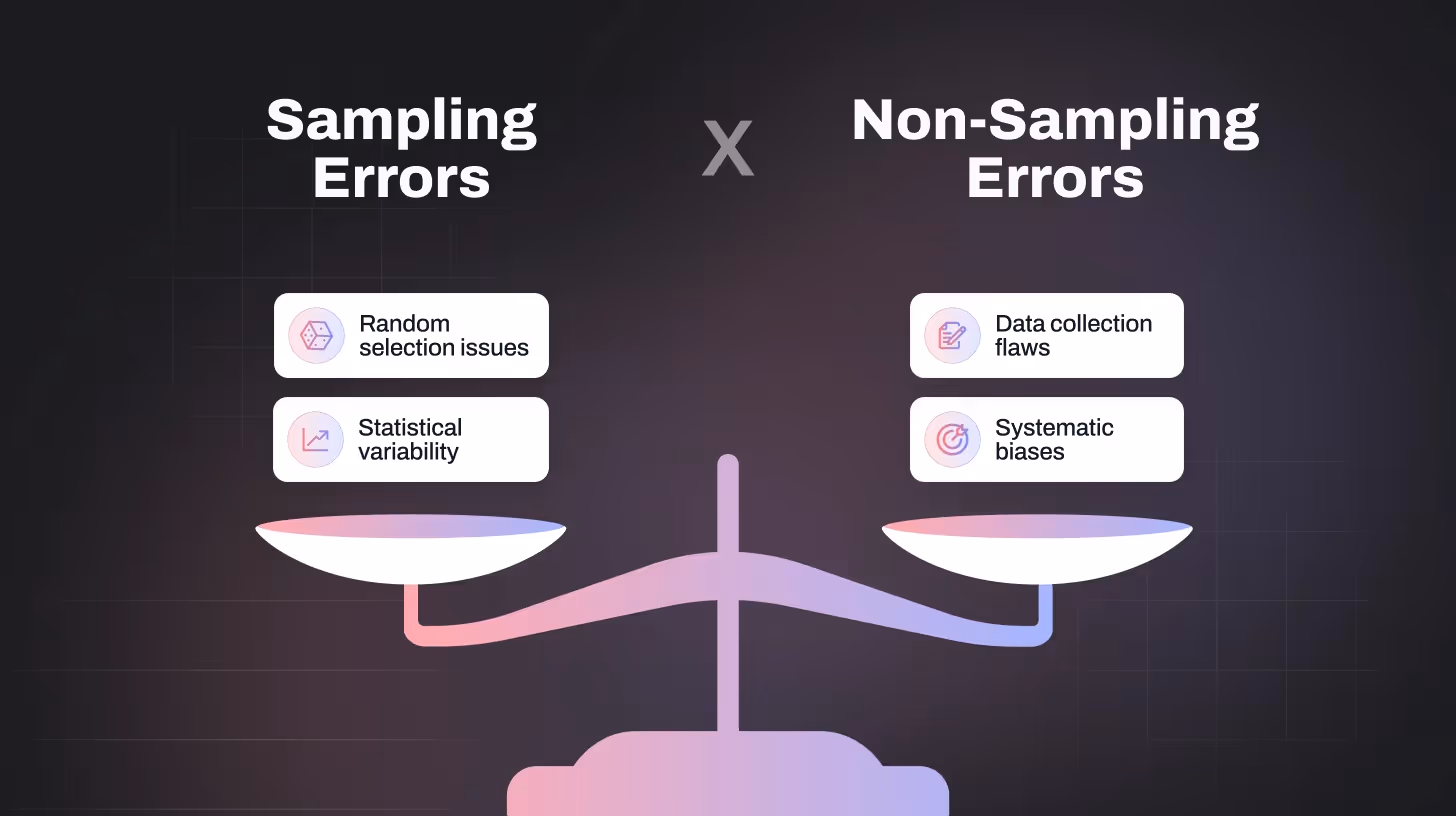
When you’re collecting data, not every error is the same. Two of the biggest culprits are sampling errors and non-sampling errors.
- Sampling error happens because your sample can never perfectly reflect the whole population. Even if you do everything right, a sample is still just a smaller slice of the bigger picture, and that naturally creates differences.
- Non-sampling error, on the other hand, comes from mistakes in the research process itself. These could be human errors, like recording answers incorrectly, asking leading questions, or leaving out certain groups during data collection.
What Is Sampling Error vs. Sampling Bias?
These two terms sound similar, but they’re not identical.
- Sampling error is the random difference between your sample results and the actual population.
- Sampling bias is a built-in problem where the sample is chosen in a way that’s known to be unrepresentative.
Sampling Error vs. Standard Error
These two terms are often confused:
- Sampling error is the actual difference between your sample results and the true population value.
- Standard error (SE) is a statistical measure that estimates how much your sample results are likely to vary if you repeated the study many times.
Read - A Complete Guide to Random Sampling Methods and Techniques
How TheySaid Helps Reduce Sampling Error
Even with random sampling, mistakes can still occur, such as over-representing one group, relying on biased panels, or introducing human error during the selection process. These issues lead to sampling error, which can distort results and reduce confidence in your insights.
TheySaid helps reduce sampling error in three key ways:
- AI-driven randomization: Every selection is handled by algorithms designed to eliminate human bias, ensuring true randomness in your samples.
- Panel-agnostic flexibility: Since you can work with any sampling provider, you’re not limited to a potentially biased or unrepresentative panel. You get to choose the audience that best reflects your research needs.
- Scalable automation: Instead of manual setups that increase the chance of errors, TheySaid automates the process, giving you consistent and reliable samples across multiple surveys.
With TheySaid, sampling isn’t just random; it’s smarter, cleaner, and more accurate, helping you trust that the insights you collect truly represent your audience.
Cut down sampling errors and get cleaner, more accurate insights. Book a demo with us today!
FAQs
Why is sampling error important in research?
Because it affects how accurately your sample reflects the population. Ignoring it can lead to misleading insights and poor business decisions.
What factors increase sampling error?
Small sample sizes, unrepresentative panels, nonresponse, and relying on biased collection methods can all increase error.
Is a margin of error the same as sampling error?
Not exactly. The margin of error is a calculated estimate of possible sampling error, usually expressed as a range (e.g., ±3%).
Does a larger sample size always mean less sampling error?
Generally, yes, but only if the sample is chosen randomly and represents the population. A bigger biased sample is still inaccurate.
What’s an acceptable level of sampling error?
It depends on context, but in most surveys, a margin of error between 2–5% is considered acceptable.


.svg)


